Problems
More and more servers hosted in cloud, what if a Windows server get hang and you even cannot connect to the server? The Windows have a great built-in tool called Performance Monitor that you can dump the server running information if get hang.
Basic
Windows have quite bunch of counters that you can leverage it to know how well about you application, service and drivers, etc. The performance monitor is used to view/check those counters and it also can trigger a log or Windows task to perform customized action if the server experiencing the issue.
In this article, I will demonstrate how to setup an alert on high CPU issue and with follow two task:
- dump system performance report built-in
- perform a customized action to get the current running SQL on SQL server hosted on this server.
Setup an dump to view system performance
First, open the Performance Monitor by searching Performance Monitor or run the perfmon.exe in the command line.
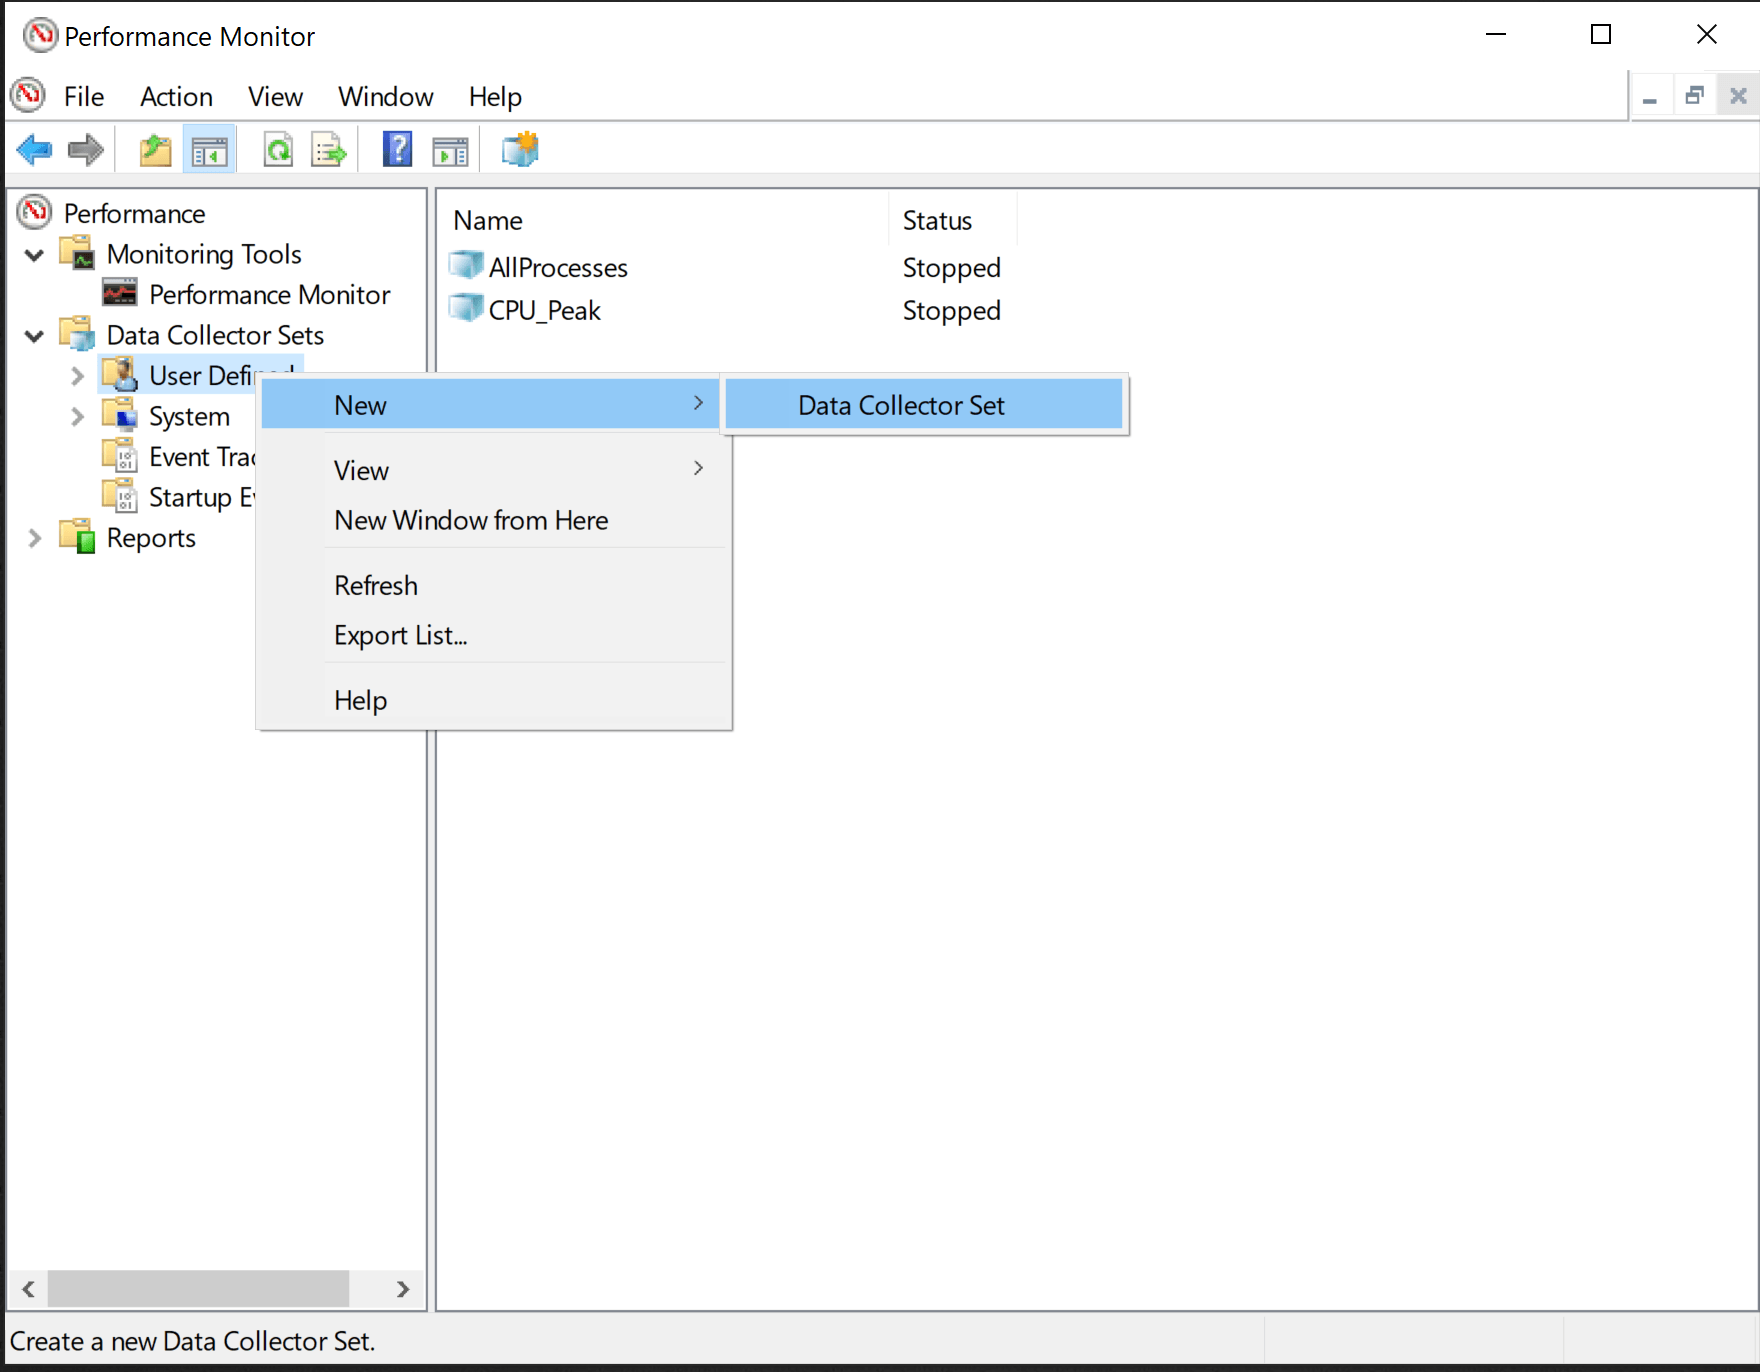
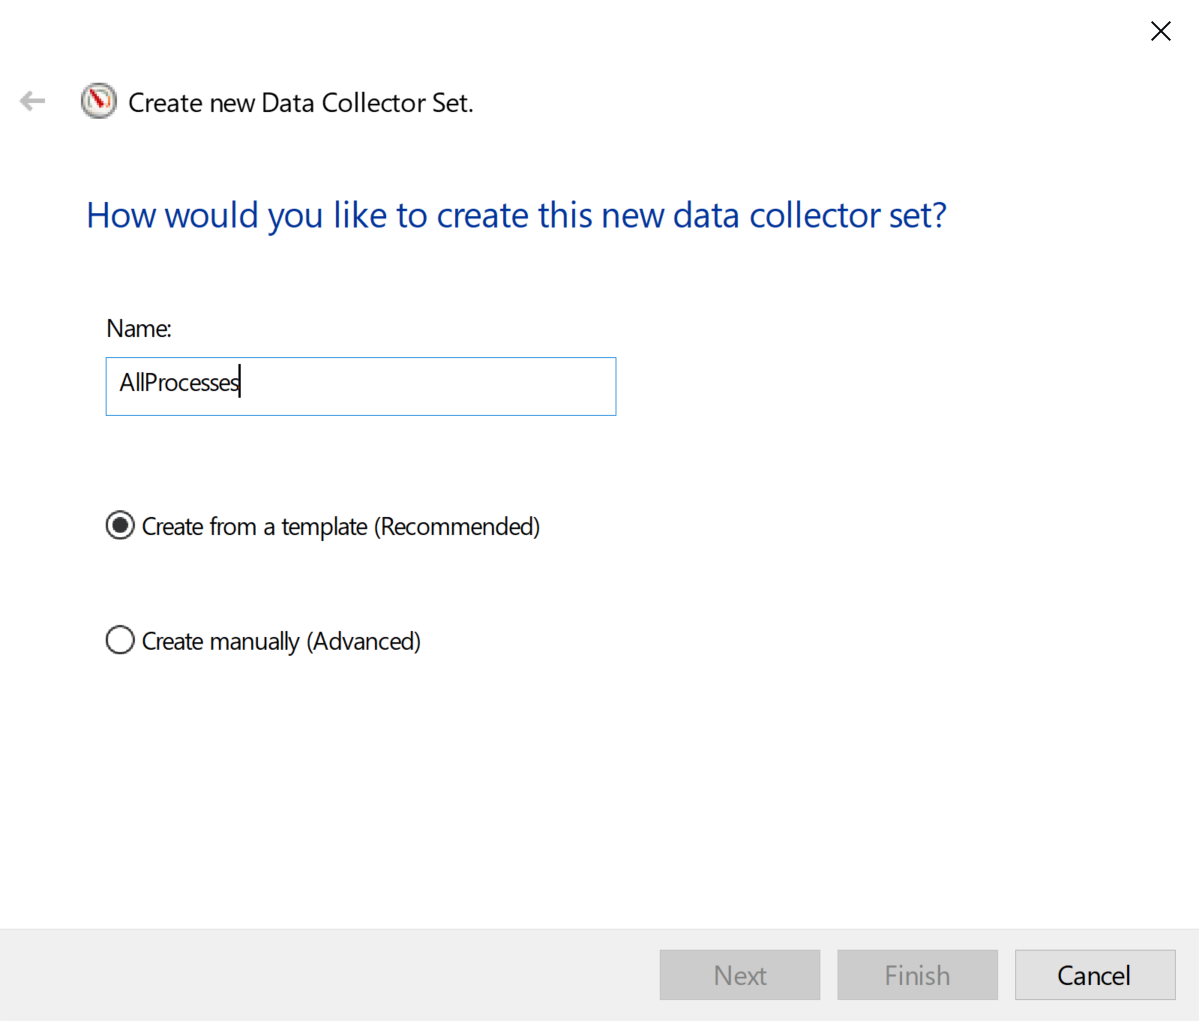
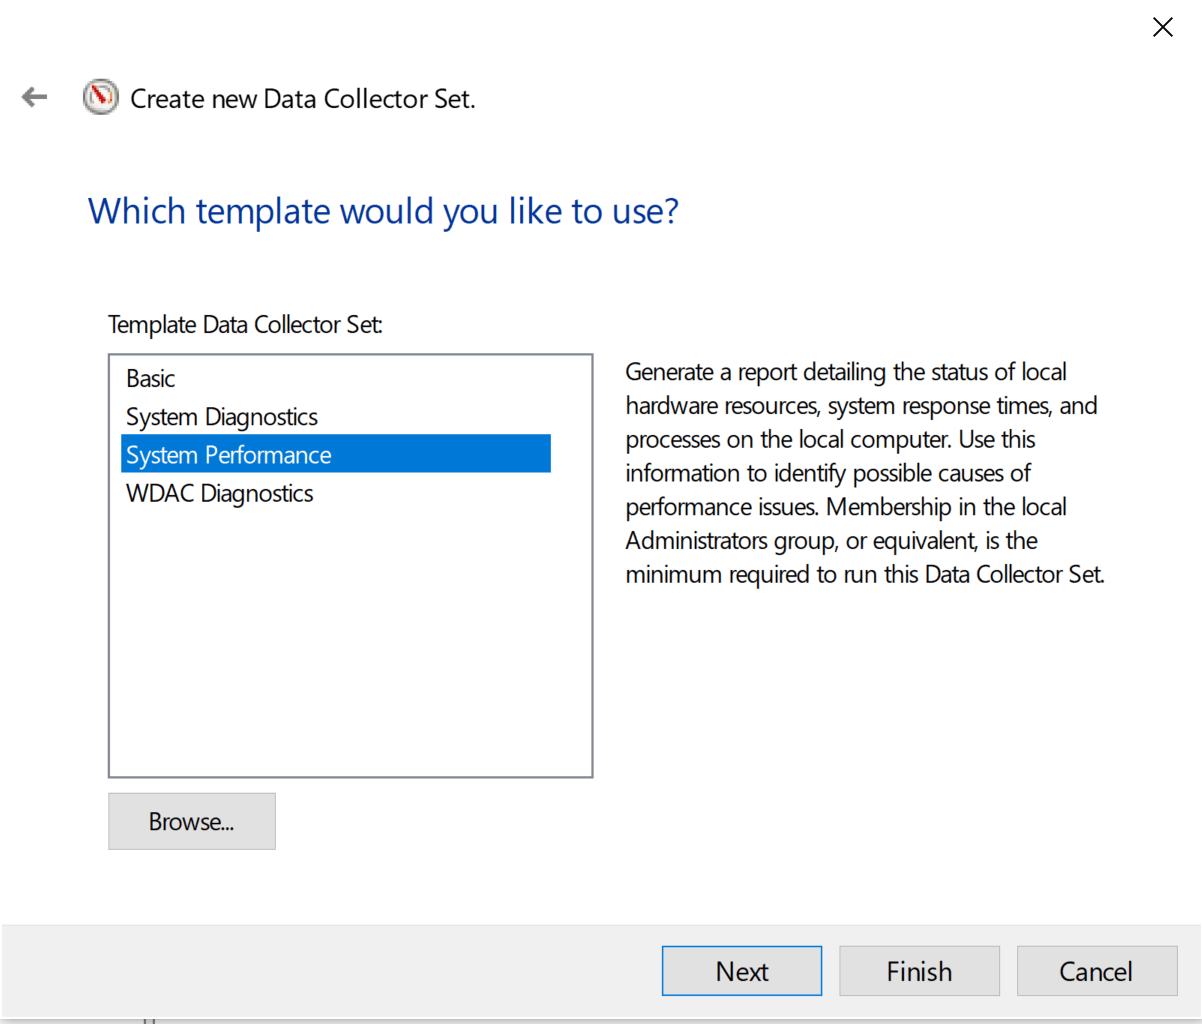
We add the new Data Collector Set by right click Data Collect Set -> User Defined -> [right click] -> New. Then create a collector from template:
To check out the collector result, you can start the collector manually by right click newly created collector and then start collector.
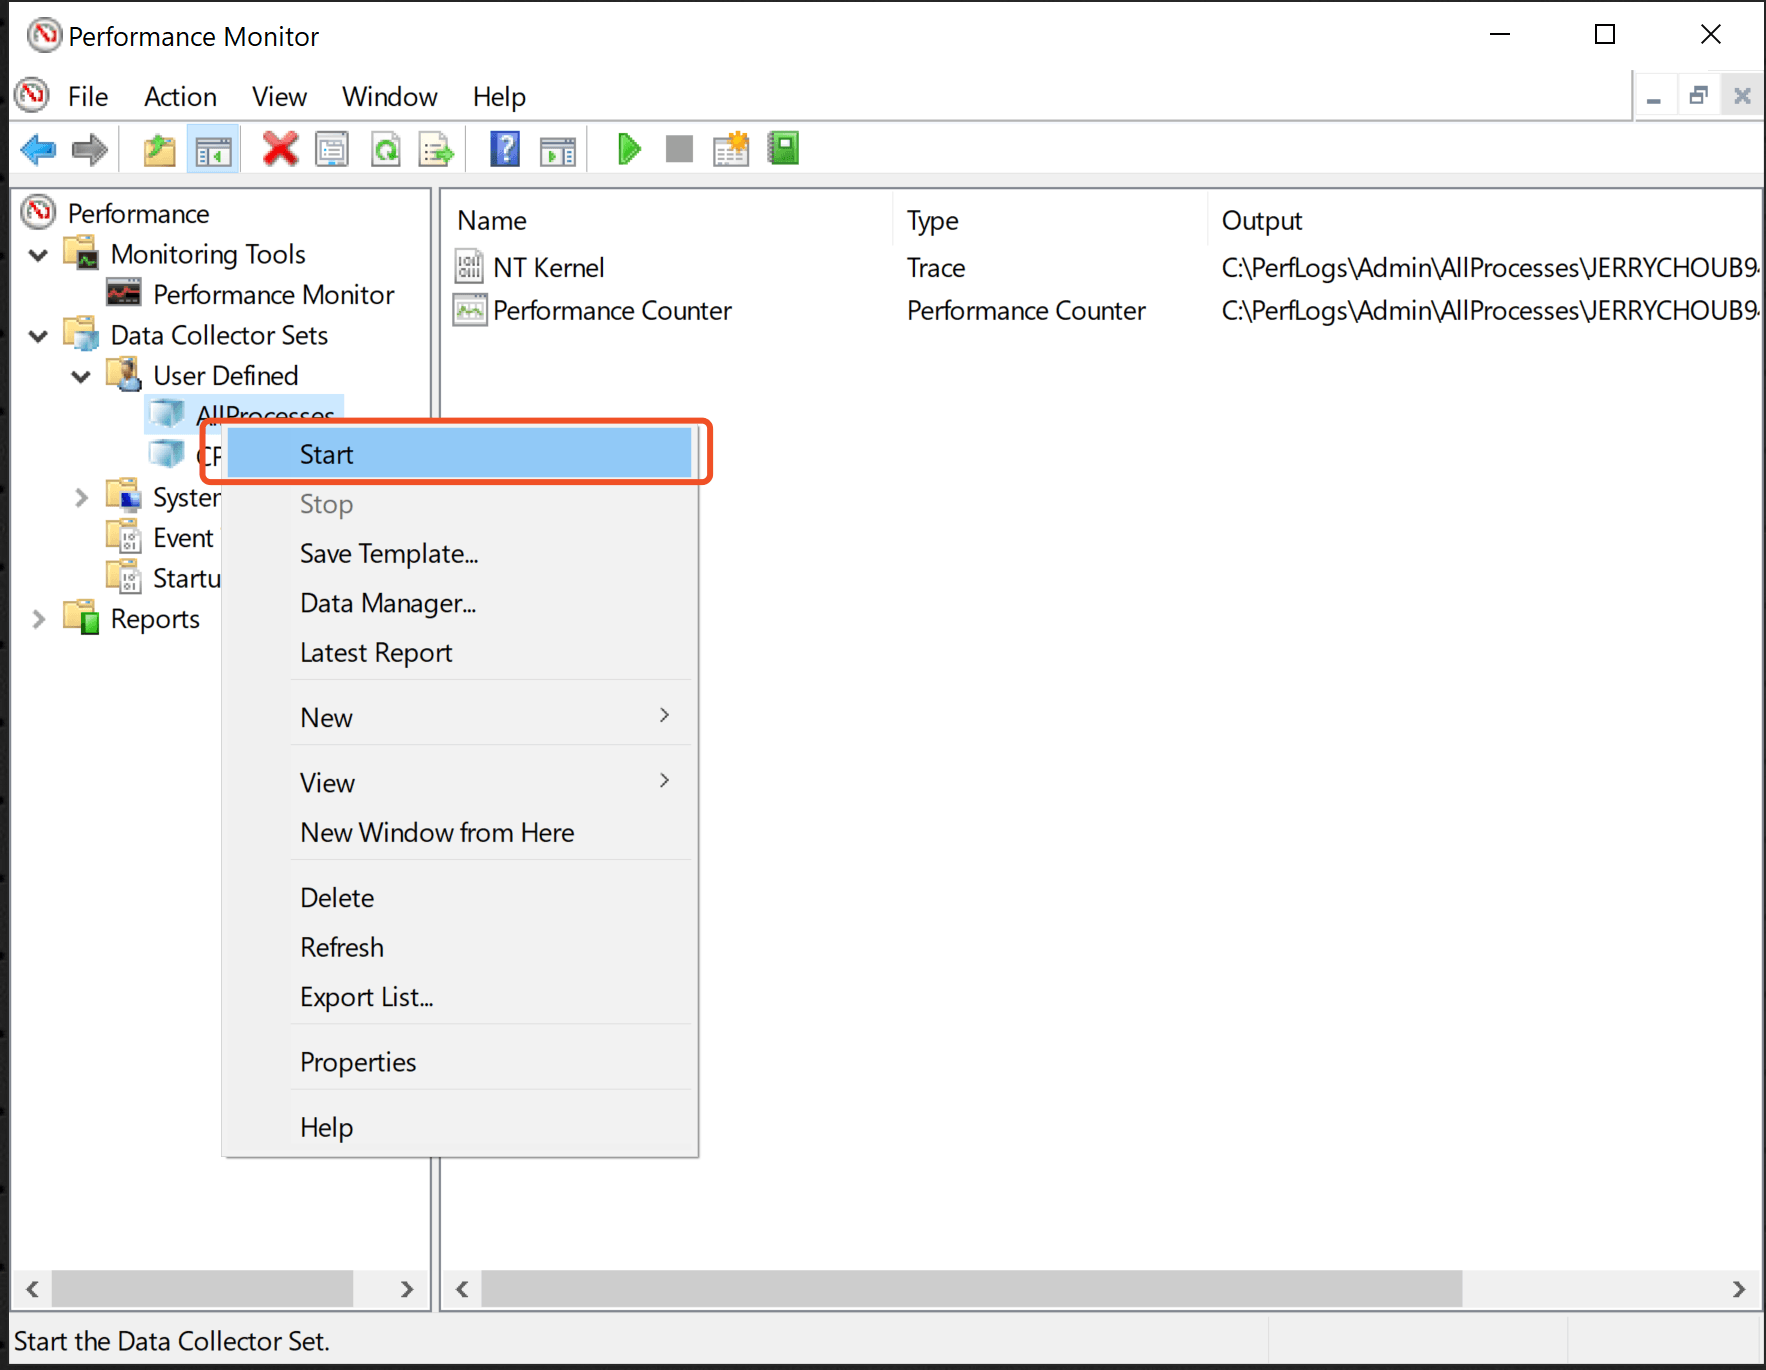
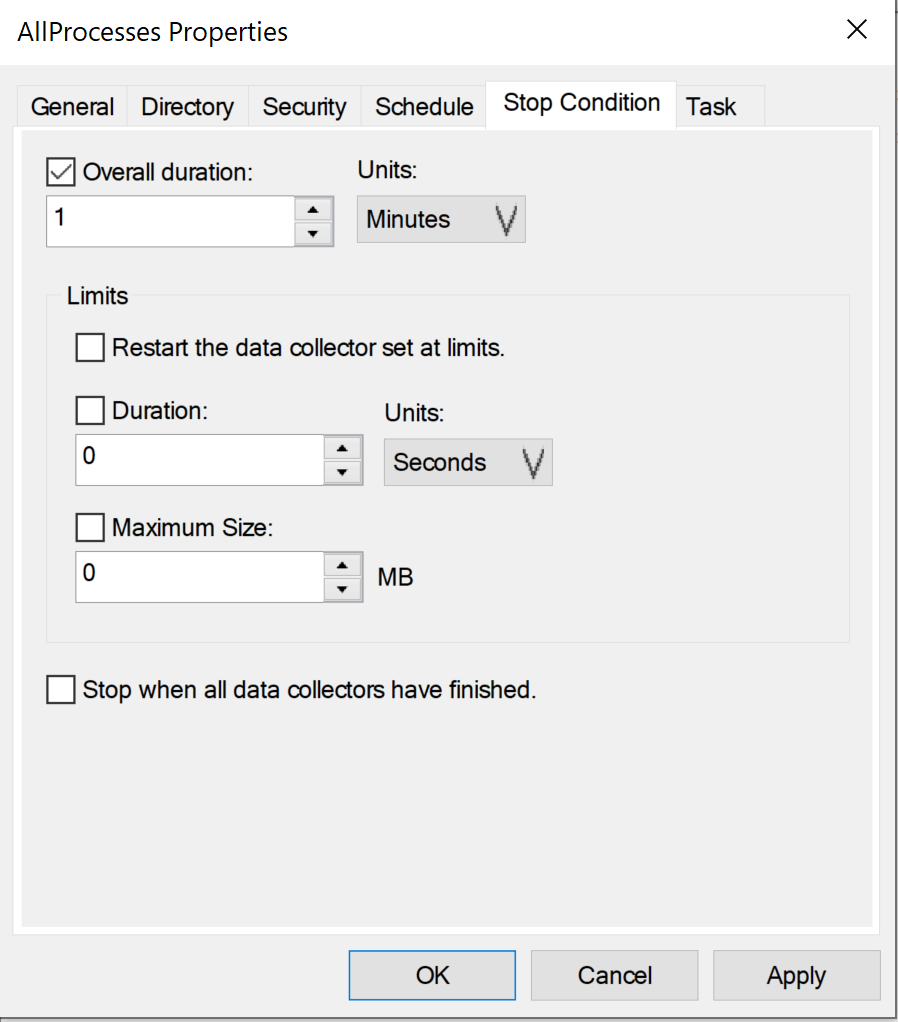
In default, the collector continue to run 1 minutes to collector the server running information. You can change the default collecting time in collector properties.
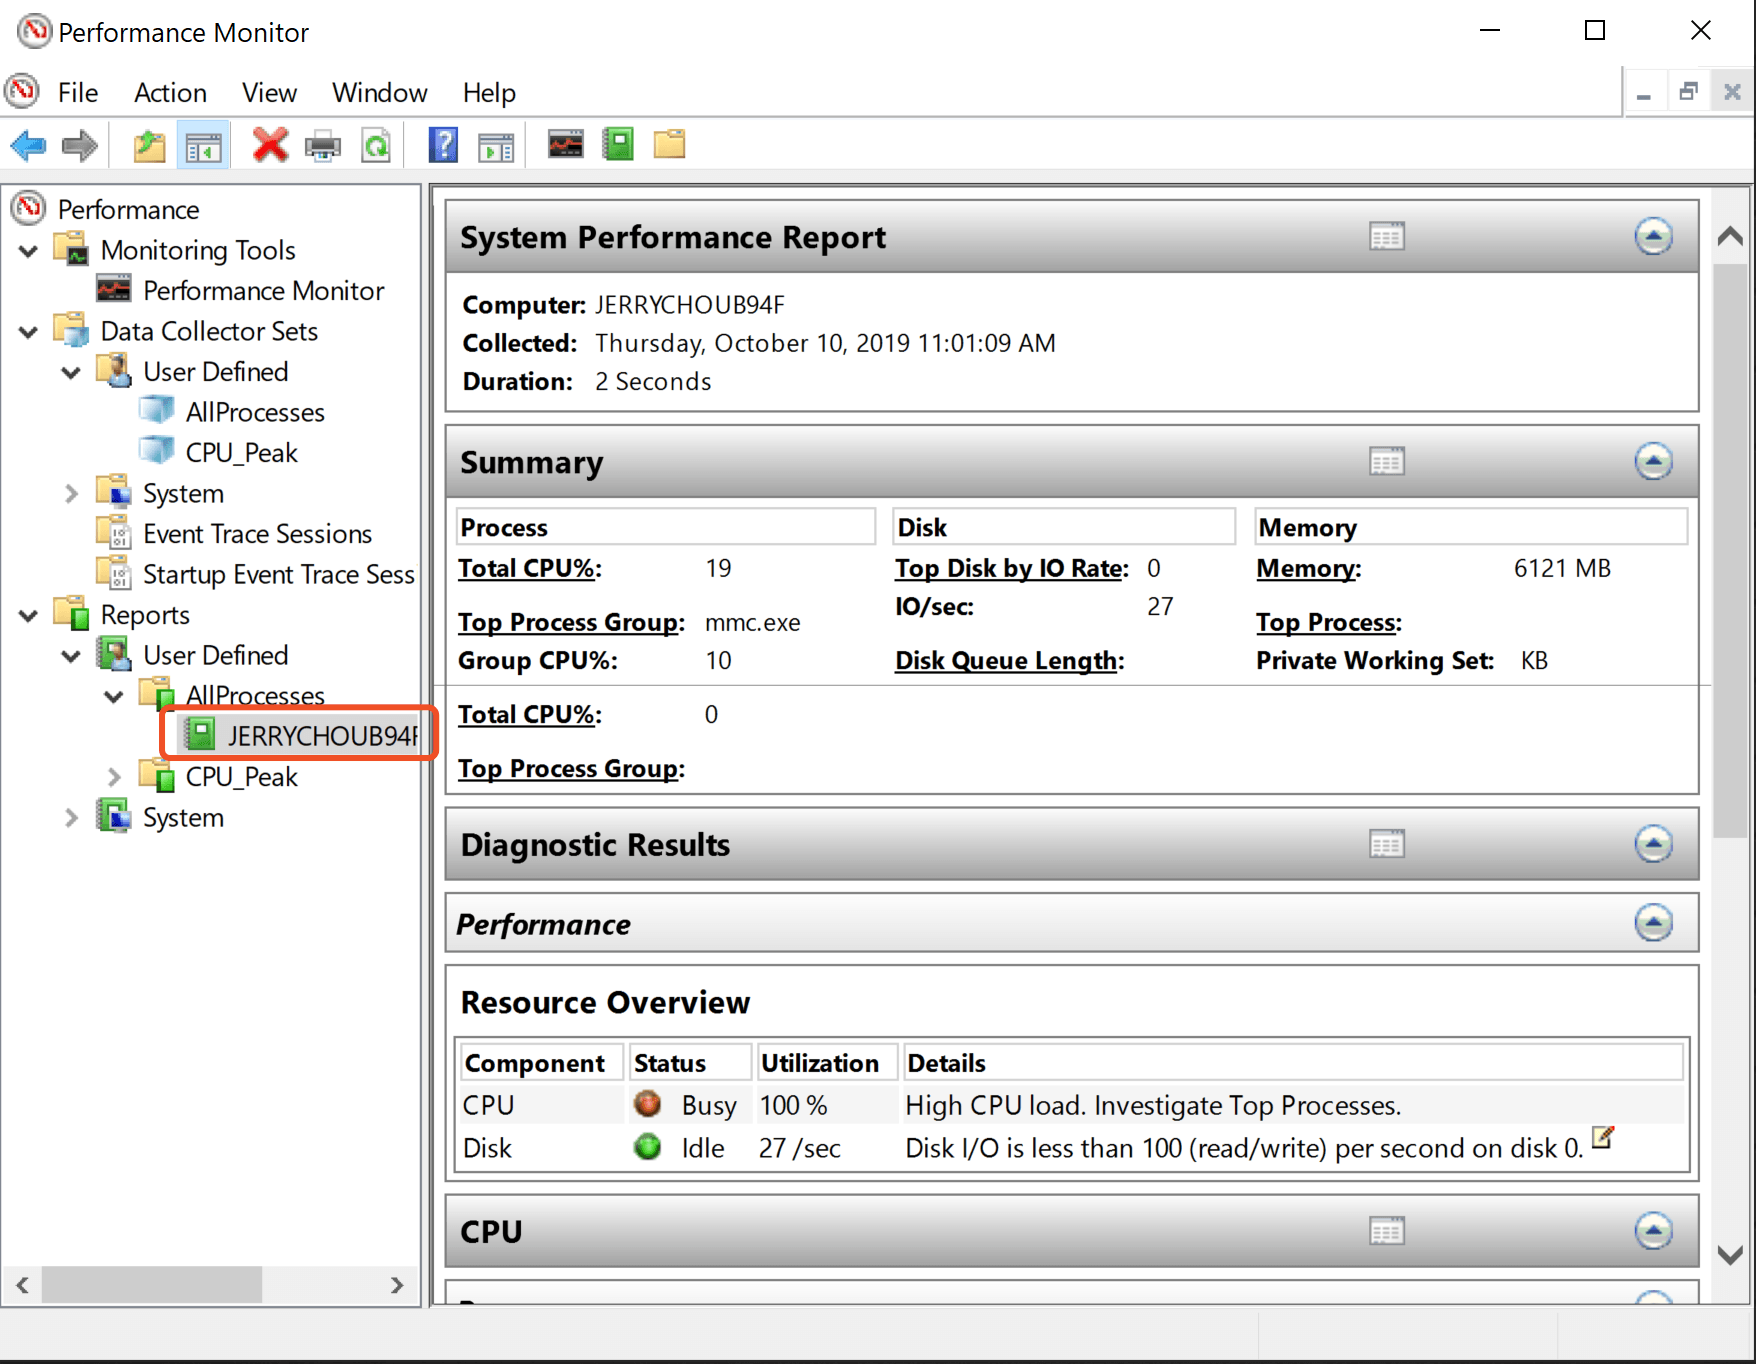
Then the you can check the report in the report section. Which contains a lot of information in 1 minutes, the processes, and memory usage, etc.
We may not want to run the collector by manually, we would like to run the collector if some issue occurs. The Performance Monitor can setup an alert that you can trigger something when server in specific condition.
Setup a high CPU alert
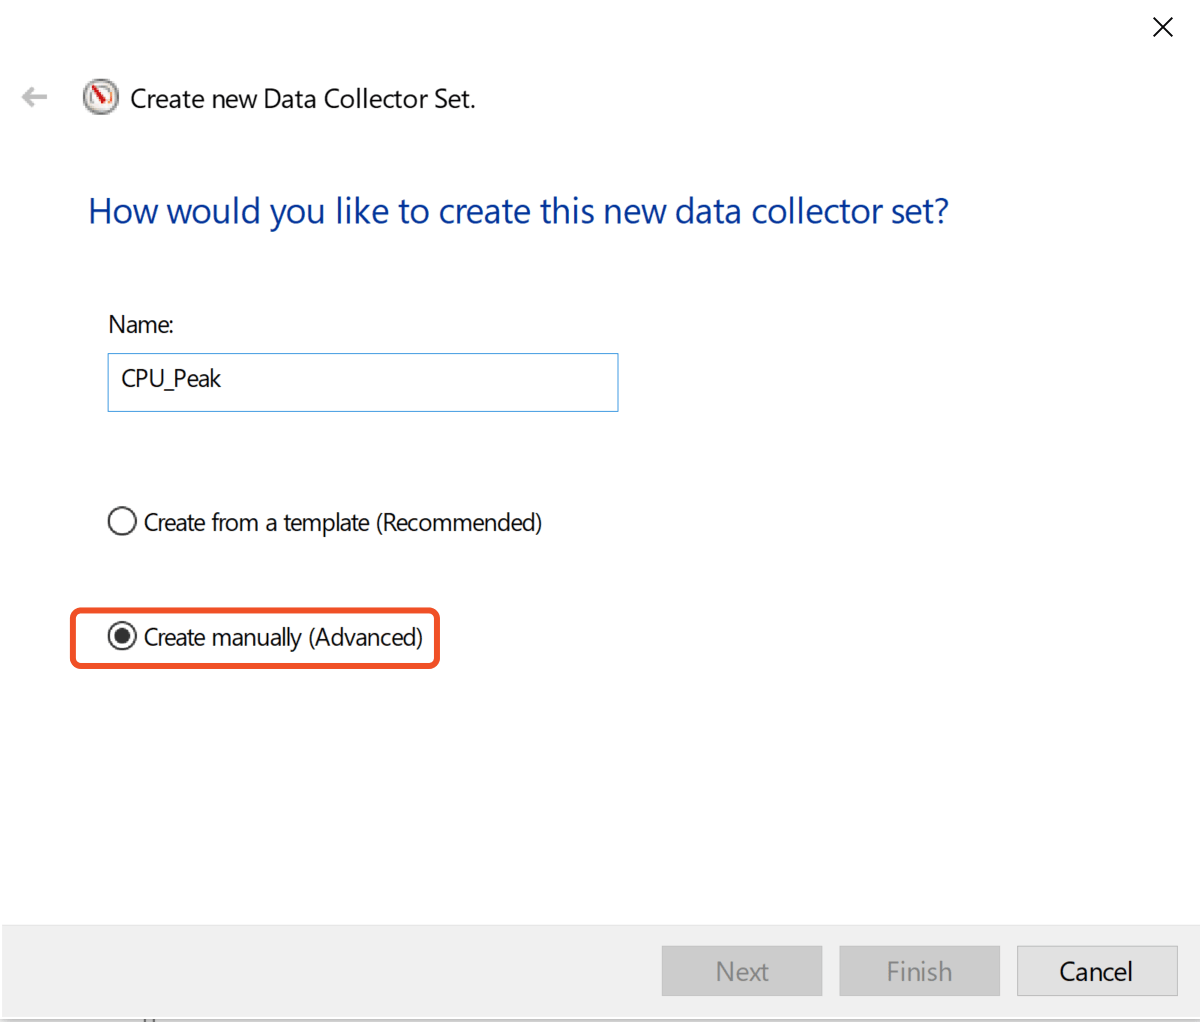
We create another User Defined Collector, in this time, we will select Create manually
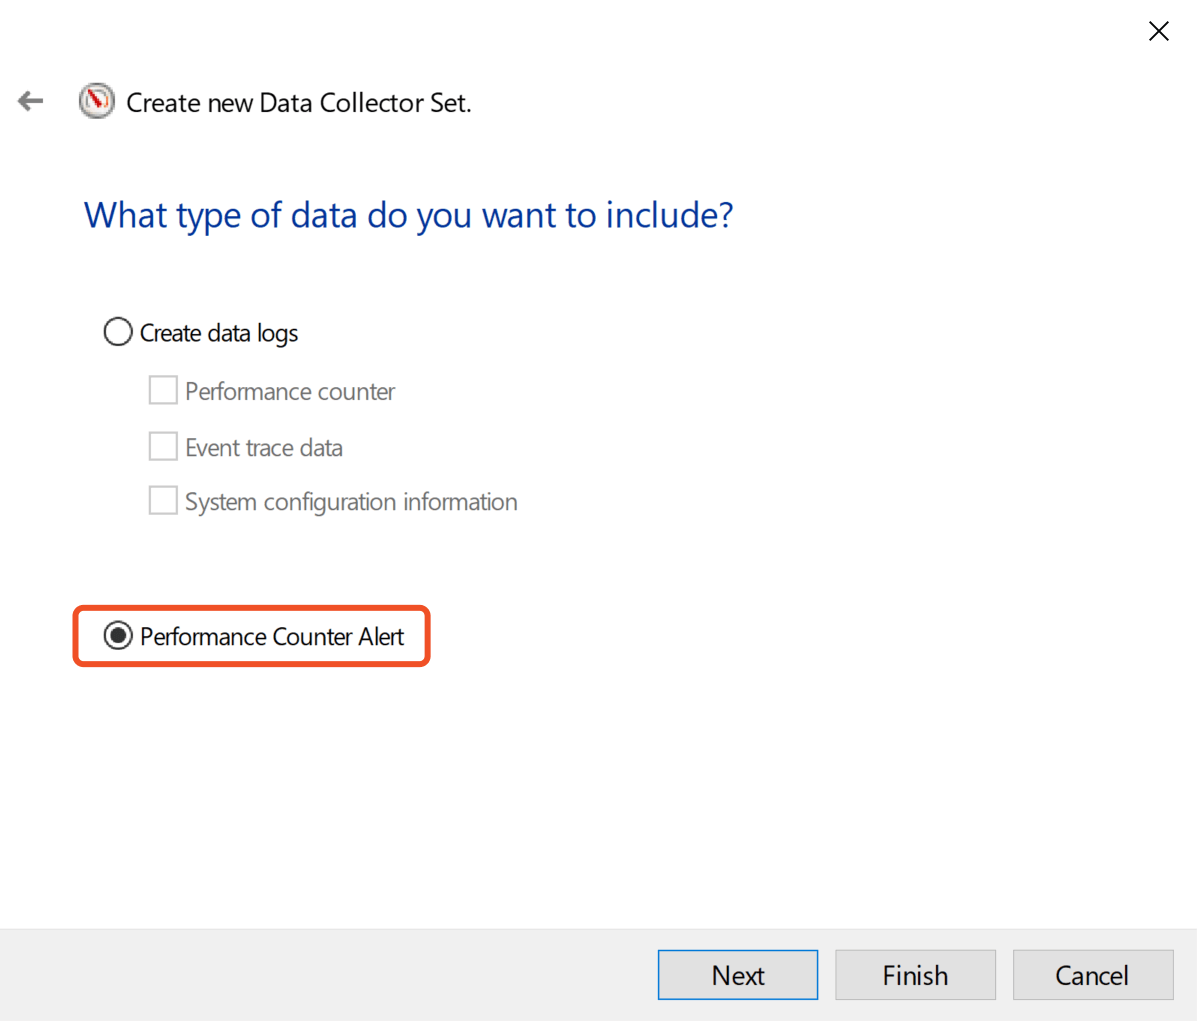
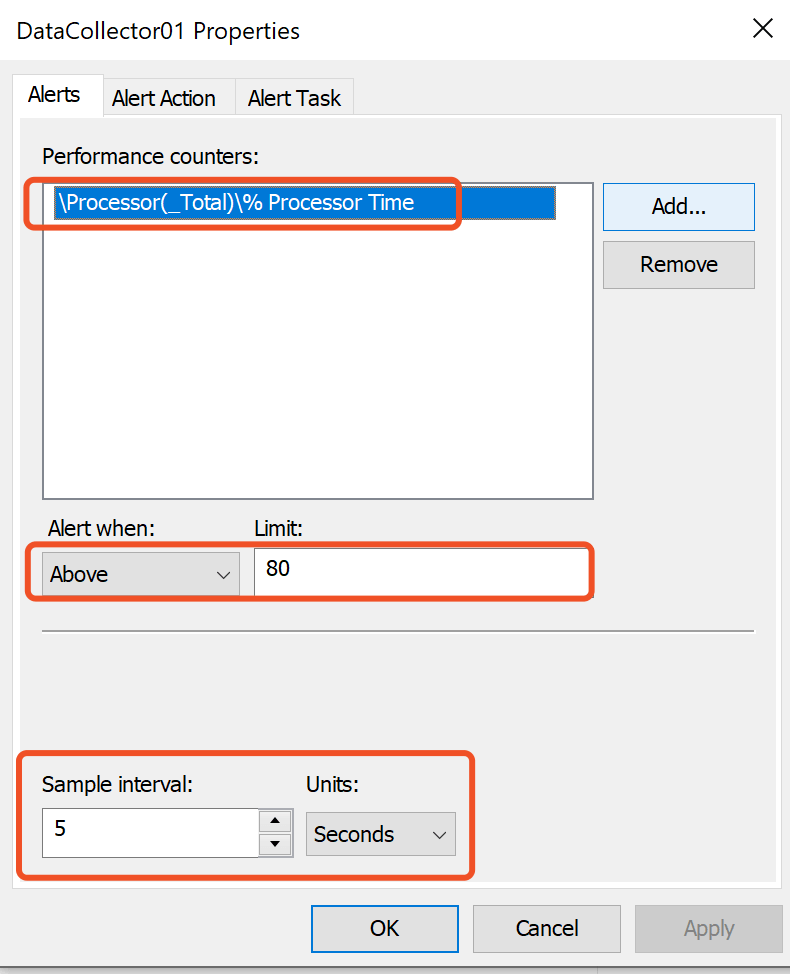
We would like to sample CPU usage in 5 seconds and check the counter of \Processor(_Total)\% Processor Time and trigger an alert if over 80% of CPU.
NOTE: The sample interval should greater than AllProcesses collector running time. Otherwise the alert will automatically stop after triggered.
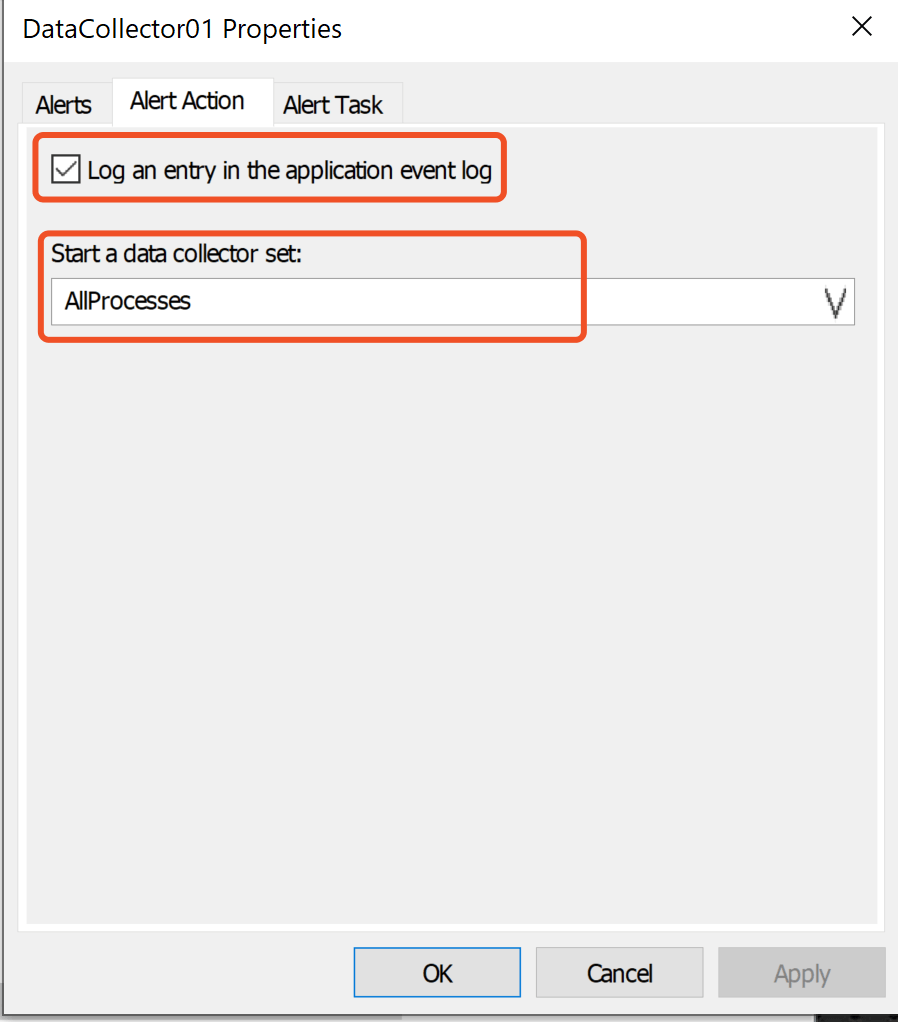
We attach two actions if alert triggered, that we will automatically start the AllProcesses collector, we also append an application event if alert happen.
NOTE: checking the application log in Windows Event Viewer in path: Applications and Services Logs/Microsoft/Windows/Diagnosis-PLA/Operational
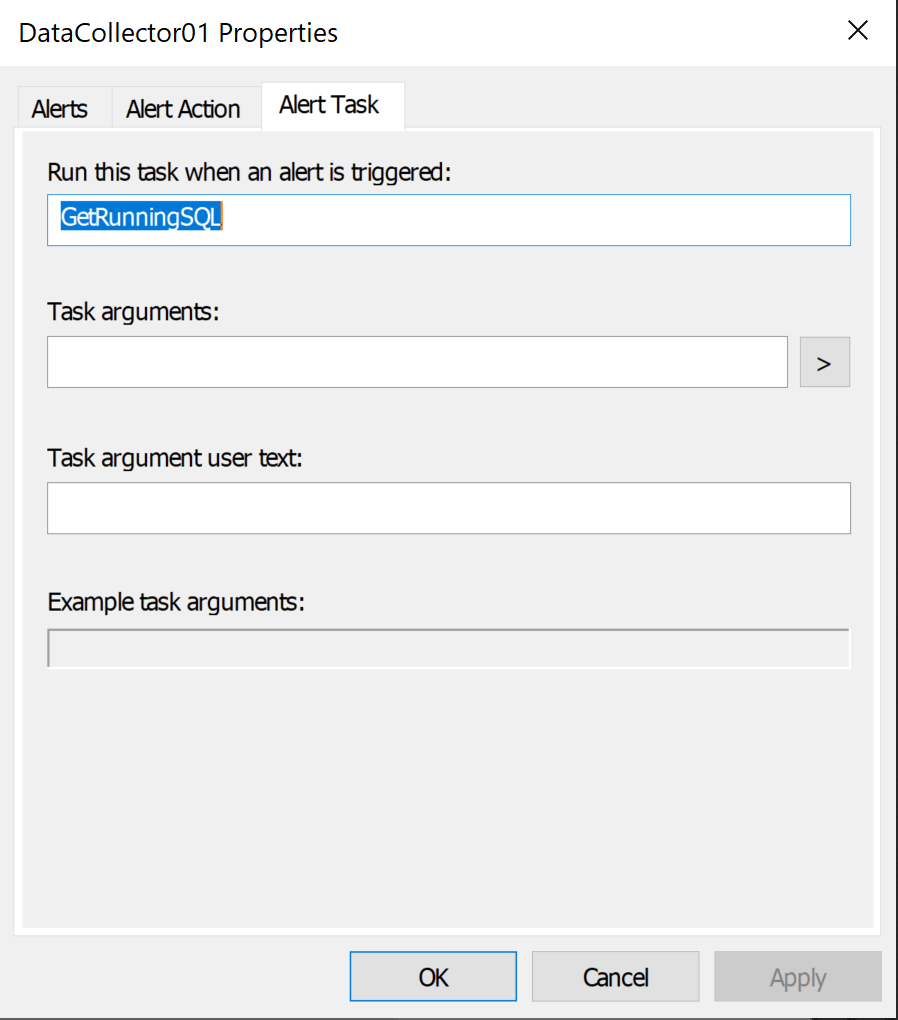
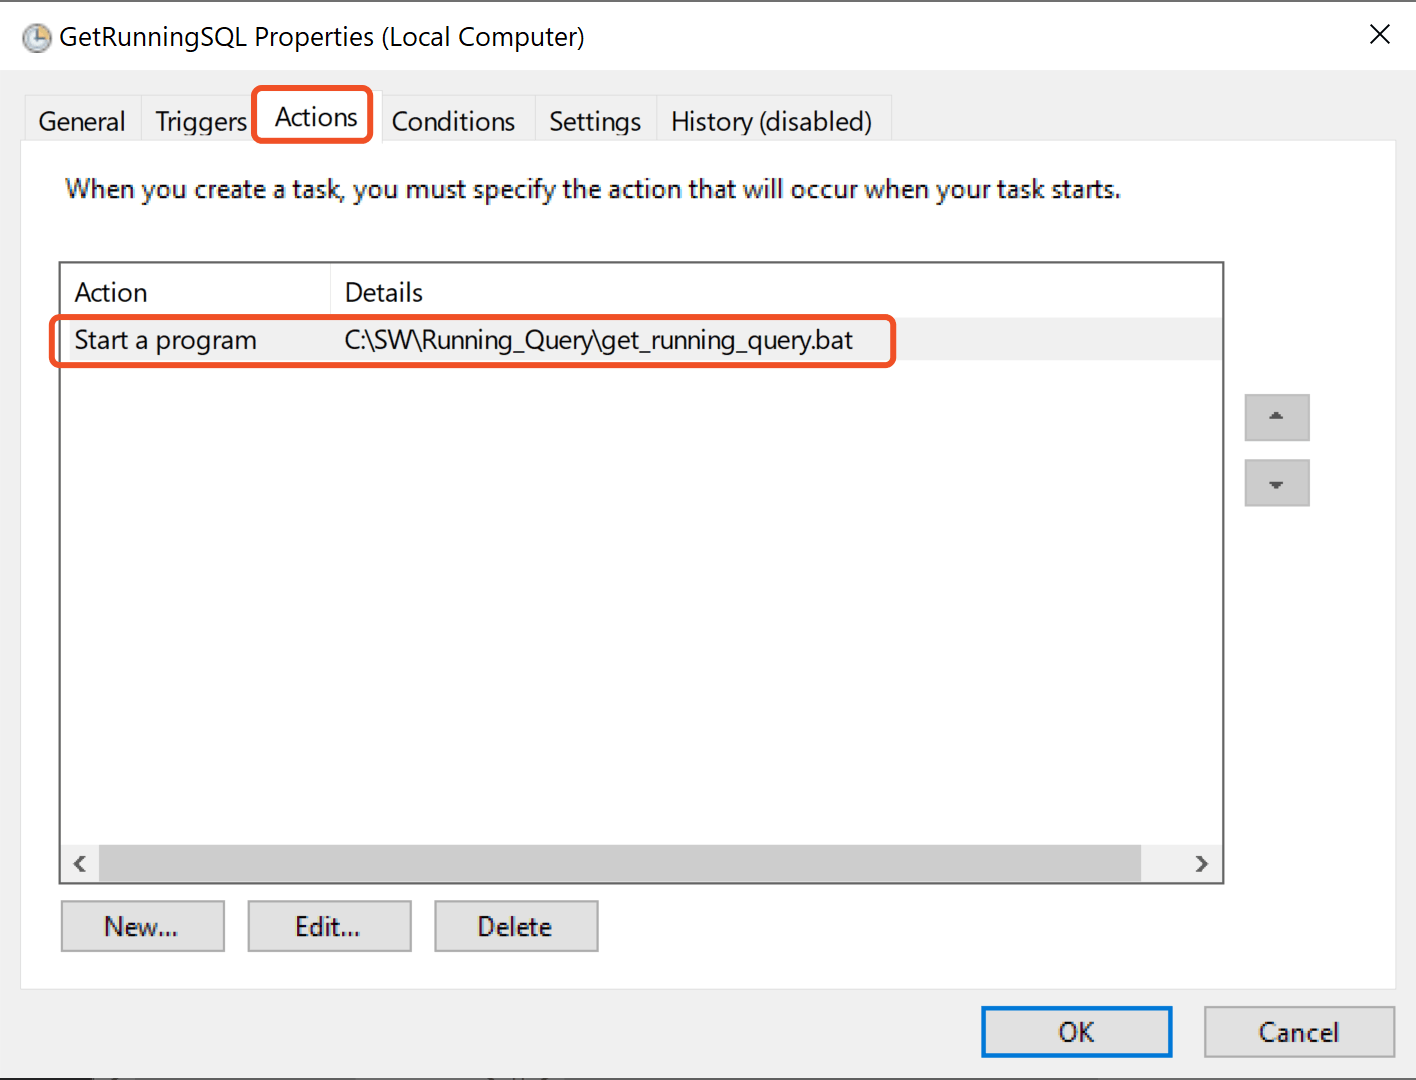
And run a Windows task that get all running SQLs
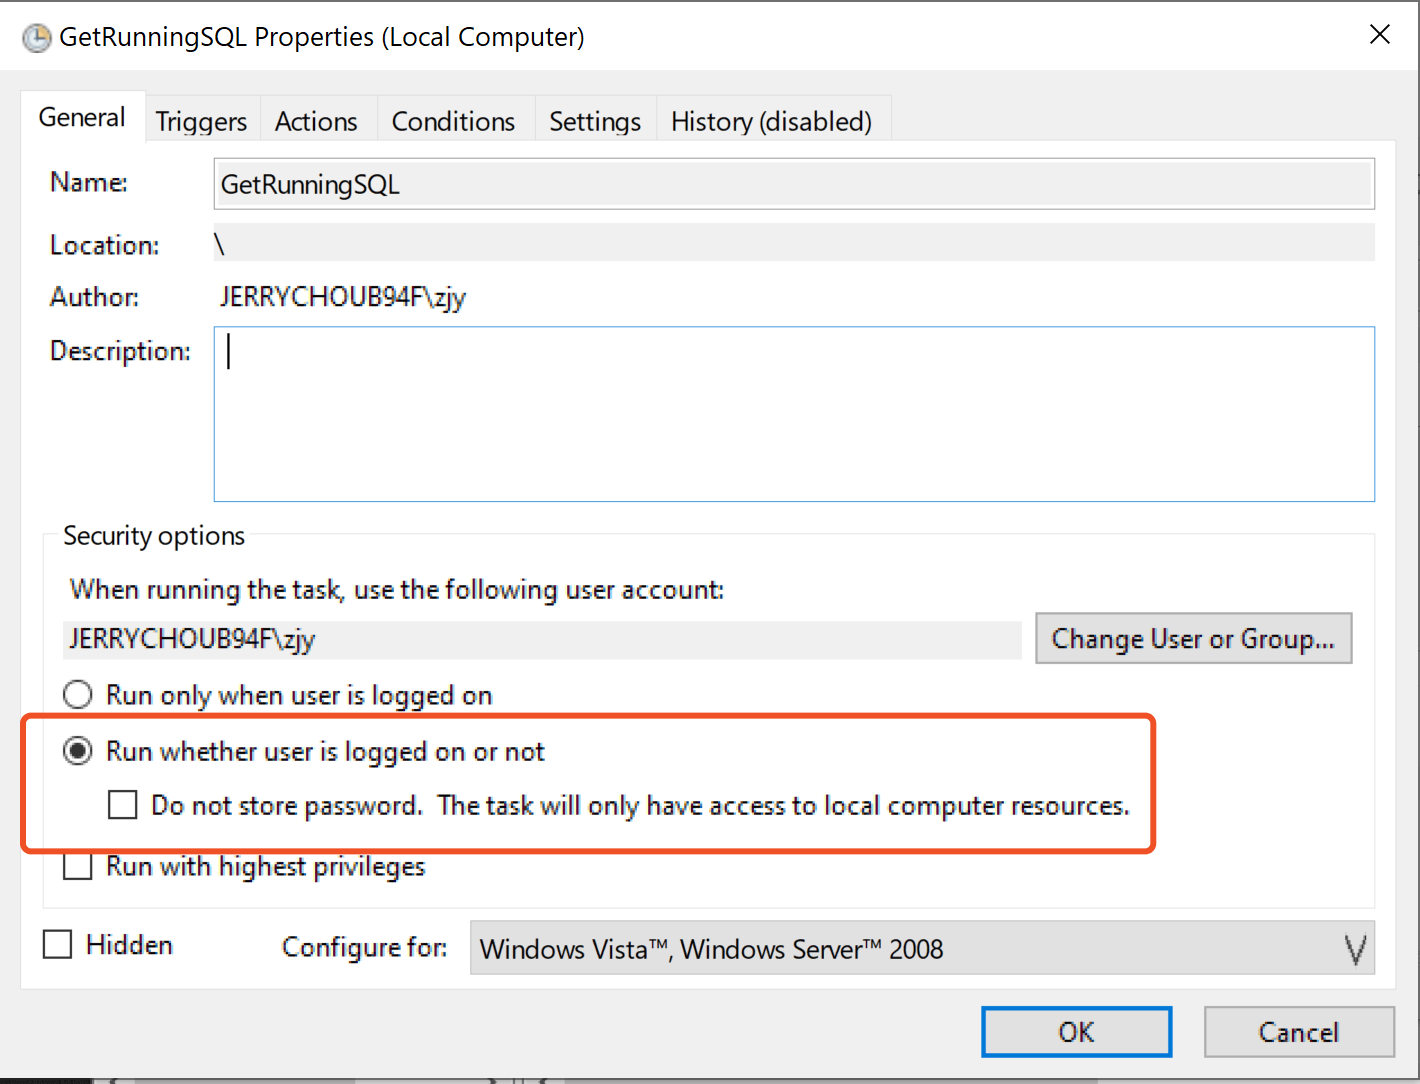
Create a Windows task to get all running SQLs
Get all of running will not work unless you setup a Windows task to get running SQLs in server. I setup a Windows task that run a SQL statement to get current running in SQL server with sqlcmd
get_running_sql.bat example:
set now=%time:~0,2%%time:~3,2%%time:~6,2%%time:~9,2%

sqlcmd -Q " SELECT * FROM sys.dm_exec_requests req CROSS APPLY sys.dm_exec_sql_text(sql_handle) AS sqltext join sys.dm_exec_sessions sess on req.session_id = sess.session_id" -o %now%.txt

exit
Start alert
The last step was to start the alert collector and waiting issue happens. The next time issue happens, you were get the server running information and running SQLs, you can check these information and setup a more specific task, eg, dump specific process, you were get on road.
Summary
The Windows built-in Performance Monitor have following advantages:
- low overhead on the server.
- built-in tools, you do not need install anything. sometimes, you just cannot
- many many counters, you can check specific counter as wish
- can trigger task, you can do a lot of things related to your issue in customized task.
Comments: